Adversarial attacks on graph-level embedding methods: a case study
In depth15:20CCAI
paperi.ai
0:00 / 0:00
Maurizio Giordano, Lucia Maddalena, Mario Manzo, Mario Rosario Guarracino
What happens when an attacker does not need to touch a model directly, but only removes selected edges from the graphs used to train it? This study shows how graph embeddings can be tested under exactly that kind of poisoning attack.
What happens when an attacker does not need to touch a model directly, but only removes selected edges from the graphs used to train it? This study shows how graph embeddings can be tested under exactly that kind of poisoning attack. As graph-level embedding techniques increase at an unprecedented speed, questions arise about their behavior and performance when training data undergo perturbations.
The external entity maliciously alters training data to invalidate the embedding, and the main attack strategy involves manipulating training data to produce an altered model. The study explores these attacks on graph datasets by applying different graph-level embedding techniques, examining methods, resources, experimental settings, and performance results.
Graph embedding finds latent vector representations of graphs that capture topology and preserve relevant network properties. These graph representations can include vertex-vertex relationships and vertex or edge attributes. The attraction is practical: vector spaces are more amenable to data science, and vector operations are often simpler and faster than equivalent graph operations.
Adversarial attacks begin when input data is altered through acquisition noise or intentional modifications, leading to misleading conclusions or reduced algorithm performance. For graph-structured data, the goal of an attack is to cause malfunctioning or fraudulent behavior through graph perturbations.
Adversarial Machine Learning studies solutions for the vulnerability of machine-learning models when adversarial perturbations compromise performance. Neural networks and many other machine-learning techniques can suffer this problem when input modifications occur during training, testing, or deployment.
The study measures the robustness of graph embedding methods, including two based on neural networks and another based on statistics, when adversarial perturbations alter training data. The altered graph-to-vector transformers are evaluated by measuring classification performance on unperturbed test graphs.
The work continues research activities that the authors identify as the only literature contributions they know of on robustness analysis for graph embedding techniques. The focus is graph-level embedding, also known as whole-graph embedding, in graph classification tasks involving biological networks.
Node-level attacks can add or remove nodes or modify target node features, while edge-level attacks can add or remove edges or modify target edge features. The number of modified nodes or edges is called the perturbation budget, and it measures the magnitude of the perturbation.
Evasion attacks modify only testing data, while poisoning attacks affect model performance by adding adversarial samples into the training dataset. The majority of adversarial attacks in graph-based machine learning is poisoning-based.
Here, these are poisoning attacks because adversarial samples are added to the training dataset, with the aim of affecting the trained model’s performance. The experimental analysis compares three graph-level embedding methods under attack conditions for graph classification.
The pipeline trains embedding models on attacked graphs and evaluates their performance on test graphs. The experimental results are discussed in the final part of the section. MUTAG is a small dataset of small graphs, PROTEINS is a much larger set of small graphs, and Kidney is a medium-sized dataset of large graphs.
MUTAG and PROTEINS are historical benchmarks widely adopted in graph-classification work during the last decade. The larger-scale Kidney dataset is adopted as a more challenging benchmark. Table one summarizes the structural and classification properties of the three graph datasets used by the authors.
MUTAG contains one hundred eighty-eight small graphs, PROTEINS contains one thousand one hundred thirteen graphs, and Kidney contains two hundred ninety-nine much larger graphs, averaging one thousand thirty-four nodes and three thousand two hundred twenty-six edges. The table also records differences in classes, node labels, edge weights, density, diameter, and average degree, showing why these datasets provide varied benchmarks for graph classification.
The attacks are edge-level perturbations consisting of removing a chosen budget of edges from the input graphs. Which edges are removed is decided according to four different criteria. The focus is the effect of targeted attacks on the graph embedding process.
Choosing edge-removal criteria based on edge relevance reflects an attack or data degradation causing significant information loss in biological networks. Figure two compares a PROTEINS graph before and after removing twenty percent of its edges, with the deleted edges highlighted in red on the left.
The removal is targeted using edge betweenness centrality, which identifies links that connect important parts of the protein structure. After the attack, the graph is visibly split into several disconnected components, illustrating how central-edge removal can destroy backbone structure and potentially degrade graph embeddings.
Netpro2vec and Graph2Vec are two embedding methods based on neural network models. These models learn a function that maps graphs into a numerical lower-dimensional space, with the mapping optimized using training graph samples one by one.
FEATHER is a probabilistic embedding model, and probabilistic models use random walks to learn global structure together with local neighborhood connectivity. The current Netpro2vec implementation cannot be directly used because its programming interface supports only transductive embedding.
Using the Doc2Vec facility to infer vector representations of new documents, or graphs in this case, the study developed iNetpro2vec to support inductive embedding. Graph2Vec graph-level embeddings are learned in a transductive manner. Because Graph2Vec shares Netpro2vec's natural-language-processing technique, Doc2Vec can infer embeddings of new samples from a pre-trained neural model.
The study developed iGraph2Vec to enable Graph2Vec to operate in inductive learning mode. FEATHER uses an r-scale random-walk-weighted characteristic function to describe graph node-feature distributions at multiple scales. It learns multi-scale node features through random walks and aggregates them by mean pooling into a numerical vector representing the entire graph structure and local neighborhood connectivity.
The resulting embedder can be applied to each graph sample separately. The experimental pipeline loads the graph dataset and splits it ten times into a training set containing ninety percent of the samples and a test set used for evaluation. Algorithm one outlines the experimental pipeline used to evaluate graph-embedding methods.
The authors report accuracy, precision, F-measure, recall, and Matthews Correlation Coefficient using stratified ten-fold cross-validation, while varying random, betweenness, eigenvector, and PageRank centrality-based attacks and the percentage of edge removal. This matters because it tests robustness under poisoning: on MUTAG, performance degrades toward null classification above twenty percent attack budget, while on PROTEINS, iNetpro2vec shows less MCC degradation as the budget increases.
The results are reported in terms of accuracy, precision, F-measure, recall, and Matthews Correlation Coefficient, or MCC. The figures plot MCC scores from stratified ten-fold cross-validation while varying the embedding method, dataset, attack type, and poisoning budget, defined as the percentage of edge removal.
Figure five tracks Matthews correlation coefficient, or MCC, on MUTAG as increasing percentages of edges are removed. The four panels compare random attacks with attacks targeting betweenness, eigenvector, and PageRank centrality, while the curves show iNetpro2Vec, iGraph2Vec, and FEATHER.
Across these attack settings, MCC values generally move toward zero as edge removal increases, although the paper notes that small attack budgets can sometimes produce slight performance improvements. Figure six reports MCC for three graph-embedding methods on PROTEINS as edges are removed, comparing random attacks with betweenness, eigenvector, and PageRank centrality-based attacks.
The four panels expose how performance changes under each attack strategy, with error bars indicating variation across measurements. This matters because it makes the robustness evaluation strategy-specific; the authors also note that eigenvector and PageRank attacks have similar effects, consistent with PageRank being a variant of eigenvector centrality.
Figure seven compares MCC for iNetpro2Vec, iGraph2Vec, and FEATHER on the Kidney dataset under four attack strategies: random, betweenness, eigenvector, and PageRank centrality-based edge removal. Across the panels, performance is plotted as the percentage of removed edges increases, with error bars showing variation.
The figure matters because it visualizes the paper’s claim that iNetpro2vec remains robust under poisoning, including targeted attacks on more central connections, while also showing the reported lack of success for FEATHER on this benchmark. Table three reports ten-fold classification metrics for iNetpro2Vec on MUTAG under random, betweenness, eigenvector, and PageRank attacks, across budgets from five to fifty.
The unattacked result is accuracy 0.82 plus or minus 0.07 and MCC 0.62 plus or minus 0.15, while the table records corresponding accuracy, precision, F1, recall, and MCC values for each attack budget. This matters because it exposes how evaluation performance is documented under progressively larger attack settings, including negative MCC values such as minus 0.03 plus or minus 0.09.
Table four reports iGraph2Vec’s performance on MUTAG without attacks and under Random, Betweenness, Eigenvector, and Pagerank attacks, across budgets from five to fifty. The unattacked result is accuracy zero point eight two plus or minus zero point zero six, with MCC zero point six one plus or minus zero point one four; the table also shows metrics and variability for each attack budget.
At budget fifty, MCC is zero point zero zero plus or minus zero point zero zero for Random, Betweenness, and Eigenvector, and negative zero point zero one plus or minus zero point zero six for Pagerank. Table five reports FEATHER’s performance on the MUTAG dataset under random, betweenness, eigenvector, and PageRank attacks, using budgets from five through fifty.
Without an attack, the reported accuracy is zero point seven three plus or minus zero point zero eight, while at budget five the attack-specific results include MCC values of zero point three nine plus or minus zero point two three for random, zero point four five plus or minus zero point two zero for betweenness, zero point four zero plus or minus zero point two two for eigenvector, and zero point two zero plus or minus zero point two two for PageRank.
At budgets ten through fifty, every attack reports the same metrics: accuracy zero point six seven plus or minus zero point zero two and MCC zero point zero zero plus or minus zero point zero zero. Table 6 reports iNetpro2Vec performance on the PROTEINS dataset under random, betweenness, eigenvector, and pagerank attacks, using budgets from five to fifty.
The table gives accuracy, precision, F1, recall, and Matthews correlation coefficient, with variability shown after the plus-minus sign. For example, the unattacked result is accuracy zero point seven one plus-minus zero point zero five, while pagerank at budget fifty reports accuracy zero point six zero plus-minus zero point zero one and MCC zero point zero three plus-minus zero point zero nine, illustrating how the reported metrics change under different attack settings.
Table seven reports iGraph2Vec performance on the PROTEINS dataset without attacks and under random, betweenness, eigenvector, and PageRank attacks, with budgets from five to fifty. The unattacked results are accuracy of zero point seven two plus or minus zero point zero four and MCC of zero point four zero plus or minus zero point zero eight.
As attack budgets vary, the table records changes across accuracy, precision, F1, recall, and Matthews correlation coefficient, showing how evaluation outcomes depend on both attack strategy and budget. Table eight reports FEATHER’s performance on the PROTEINS dataset under random, betweenness, eigenvector, and pagerank attacks, across budgets from five to fifty.
The table includes accuracy, precision, F one, recall, and Matthews correlation coefficient, with values shown as means plus or minus variability. For example, the unattacked setting reports accuracy of zero point six nine plus or minus zero point zero four, while the random attack at budget ten reports F one of zero point six five plus or minus zero point zero five and MCC of zero point three six plus or minus zero point one two.
Table nine reports iNetpro2Vec performance on the Kidney dataset under random, betweenness, eigenvector, and PageRank attacks, using accuracy, precision, F1, recall, and MCC. The table includes attack budgets from five through fifty, with means and standard deviations; for example, under eigenvector attack at budget fifty, accuracy is zero point eight six plus or minus zero point zero seven and MCC is zero point seven seven plus or minus zero point one two.
This matters because it documents how performance measurements vary as the attack setting changes. The central takeaway is that graph-level embedding methods can respond very differently to edge-removal poisoning, depending on the dataset, attack criterion, and embedding method.
Robustness therefore has to be measured experimentally, not assumed from clean-data performance alone.
A derivative work by Paperi · AI-generated script, voice and captions
· pages and figures unaltered
Made with Paperi.
Drop in a research PDF — get a narrated video walkthrough like this one,
with highlights that follow the narration. Free to start.
A blockchain label is not automatically valuable. This study finds that it becomes worth paying for mainly when enough shoppers care deeply about whether a product is genuinely high quality.Blockchain can make supply chains more transparent, but this paper shows that transparency does not automatically make everyone better off. The payoff depends heavily on how much consumers care about product quality.
A vaccine can be perfectly made and still fail before reaching a patient. Its safety may depend on an invisible journey: keeping it cold, watched, and accounted for every step of the way.Keeping a COVID-19 vaccine cold is only part of the challenge. This study asks which Internet of Things platform can manage the wider logistics problem, and its model selects Microsoft Azure IoT.
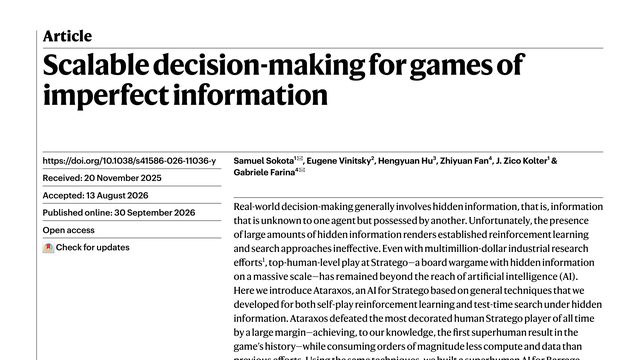
Samuel Sokota, Eugene Vinitsky, Hengyuan Hu, Zhiyuan Fan, J. Zico Kolter, Gabriele Farina
For years, computers could master games where everything was visible, but hidden information stopped them cold. Then one system beat Stratego’s most decorated human player by a margin never seen at the highest level.Stratego has enormous hidden information, and years of expensive AI research still could not beat its best humans. This paper introduces an approach that wins decisively, and does so with only a few thousand dollars of training.
 3:38