Spatial Inequities in Life Expectancy in Small Areas of Buenos Aires, Argentina 2015–2017
In depth13:30CCAI
paperi.ai
0:00 / 0:00
Andrés Trotta, Usama Bilal, Binod Acharya, Harrison S. Quick, Kari Moore, Mónica Serena Perner, Marcio Alazraqui, Ana Diez Roux
What if life expectancy changed dramatically not between countries, but between neighborhoods of the same city? In Buenos Aires, the gap between small areas reached 9.3 years for women and 14.9 years for men.
What if life expectancy changed dramatically not between countries, but between neighborhoods of the same city? In Buenos Aires, the gap between small areas reached 9.3 years for women and 14.9 years for men. Studies of life expectancy in small areas of cities are relatively common in high-income countries but rare in Latin American countries.
Small-area estimation methods can help to describe and quantify inequities in life expectancy between neighborhoods and their predictors. The objective was to analyze the distribution and spatial patterning of life expectancy across small areas of Ciudad Autónoma de Buenos Aires, Argentina, and its association with socioeconomic characteristics.
More than 80% of the population of Latin America resides in urban areas, and urban growth has been especially intense in the last half-century. Latin America is also a highly unequal region, with strong residential segregation within countries and cities.
Urbanization and segregation directly impact spatial inequities in health outcomes, including mortality and life expectancy. Studies of mortality and life expectancy within urban areas are more common in high-income countries but remain limited in low- and middle-income countries, while much research in Latin America uses city-level indicators rather than small areas.
Challenges for small-area estimation include defining what a small area is, statistical noise around death counts with small populations, and data availability, especially given confidentiality concerns. Previous studies found wide inequities in life expectancy for sub-city units in Latin American countries, but there has been little examination of life expectancy heterogeneity within rapidly growing cities of low- and middle-income countries.
The study used the census fraction defined by Argentina’s National Statistics Office as its unit of analysis because of the death count required for a reliable small-area estimate and its spatial delimitation for census data collection. Ciudad Autónoma de Buenos Aires is the administrative and political center of Argentina, located in the Buenos Aires metropolitan area, which houses 31.9% of the national population.
Significant inequities in social and environmental conditions exist across the city, even though it has a relatively low illiteracy rate, high access to resources, and a lower proportion of the health-uninsured population. Studies on social inequity in CABA have focused on social maps and multiple dimensions of the city’s sociospatial structure.
To the authors’ knowledge, no studies had examined variations in life expectancy within CABA using high spatial resolution data to address neighborhood health effects. The study used state-of-the-art methods to describe the distribution and variability of life expectancy at birth for 2015 to 2017.
It also characterized the spatial patterning of life expectancy across small areas and analyzed its association with socioeconomic characteristics. This was an ecological study using vital registration data from the 351 census fractions of CABA in 2015 to 2017.
Census fractions, called small areas, are geostatistical census units based on an average of 5,000 households and defined by Argentina’s National Institute of Statistics and Census. The study used georeferenced death registry records for CABA from the Directorate General of Statistics and Censuses for the three-year period.
Population data came from the 2010 census and population projections created for 2010 and 2015 to 2017, while socioeconomic data came from the 2010 census. Death records were georeferenced to the small-area level by the SALURBAL project using street-address shapefiles created by the CABA government’s geographic information systems unit.
Among 89,410 recorded deaths, deaths not georeferenced to small areas were excluded, resulting in 88,330 analyzed deaths. The death counts were then aggregated by small area, single-year age, and sex for the pooled period from 2015 to 2017. The socioeconomic measures were water access inside dwellings, household overcrowding, school attendance among fifteen- to seventeen-year-olds, completion of at least high school among people aged twenty-five or above, and unemployment.
These variables were selected because previous studies linked them to life expectancy and mortality in Latin American cities, and because they are commonly available from small-area census data. Each variable was used as a marker of the general small-area socioeconomic effect, rather than as a marker of education, overcrowding, or water access alone.
The study also computed a composite Z-score to reduce measurement error in estimating socioeconomic status. Life expectancy was computed from single-year, age-specific, and sex-specific mortality rates estimated with a Bayesian adaptation of the Tool for Projecting Age-Specific Rates using Linear Splines method.
The city-level mortality schedule served as the standard mortality schedule, and smoothed rates from a LOESS regression were used to address unstable log mortality rates. The Bayesian model ran the Markov Chain Monte Carlo algorithm for 100,000 samples; the first 80,000 were discarded as burn-ins, and the remaining samples were thinned by a factor of 10.
The study retained 2,000 sets of age-specific and sex-specific mortality rates from the posterior distributions and entered them into standard single-age life tables. To describe inequities, the study calculated the tenth and ninetieth percentiles of life expectancy across small areas by sex and computed the ninetieth-minus-tenth percentile gap.
Choropleth maps were created with ArcGIS Pro to describe the spatial patterning of life expectancy. Associations with socioeconomic characteristics were estimated with linear regressions, using each predictor converted into deciles and scored continuously from zero to one.
The models were repeated 2,000 times with posterior estimates to acknowledge uncertainty, and coefficients were pooled using Rubin’s formula. Between 2015 and 2017, there were 88,330 deaths in the 351 small areas of CABA.
Median life expectancy at birth across small areas was 81.9 years for women and 76.7 years for men, and the same pattern held at ages 20, 40, and 60. Life expectancy ranged from 76.6 to 85.9 years for women and from 68.1 to 83.0 years for men, producing gaps of 9.3 and 14.9 years between areas with the highest and lowest life expectancy.
The ninetieth-minus-tenth percentile difference was 2.9 years among women and 5.3 years among men. Figure one shows life expectancy at birth for the three hundred fifty-one small areas of Ciudad Autónoma de Buenos Aires, separately for women and men in twenty-fifteen to twenty-seventeen.
Areas are ordered by their posterior median estimate, with gray bands showing ninety-five percent credible intervals. The chart makes the city’s spatial variation visible: estimates range from seventy-six point six to eighty-five point nine years for women, and from sixty-eight point one to eighty-three point zero years for men, highlighting substantial intraurban inequality.
The study found a general north–south spatial gradient for life expectancy at birth. Life expectancy was higher in the north and northeast parts of the city than in the south and southwestern areas, where life expectancy was lower.
A strip in the central region also had higher levels of life expectancy and was surrounded by other areas with low life expectancy. Figure two maps life expectancy at birth across small areas of Buenos Aires separately for women and men, using progressively darker shades for different life-expectancy ranges.
The authors identify a broad north-to-south gradient, with higher values in northern and northeastern areas, lower values in southern and southwestern areas, and a distinct higher-life-expectancy strip through the central region. This visualization matters because it reveals substantial spatial heterogeneity within the city, linking health inequality to the socioeconomic patterning of neighborhoods.
Education, school attendance, and accessibility to water were positively associated with life expectancy, while unemployment and overcrowding were negatively associated. All socioeconomic variables were associated with life expectancy at birth, and the magnitude of association was stronger among men.
Men in areas with the highest education decile had 5.63 years higher life expectancy at birth than men in areas with the lowest education levels, while the corresponding association among women was 2.99 years. Men and women in areas with the highest unemployment had 4.72 and 2.52 years lower life expectancy than those in areas with the lowest unemployment.
Table two reports the slope index of inequality in life expectancy at birth across small areas of Ciudad Autónoma de Buenos Aires, separately for women and men. Positive values correspond to characteristics such as education, school attendance, and indoor water, while overcrowding and unemployment have negative values; the composite Z-score is 2.79 years for women and 5.61 years for men.
Because each model compares the tenth with the first decile, using socioeconomic data from the 2010 census, the table quantifies how strongly area-level conditions are associated with life expectancy. The study found spatial heterogeneity and intraurban variability in life expectancy at birth and at ages 20, 40, and 60 in CABA.
Overall, life expectancy at birth was 5.2 years higher for women than for men: 81.9 versus 76.7 years. The ninetieth-minus-tenth percentile gap within the city was 2.9 years for women and 5.3 years for men, alongside north–south spatial patterning and a transitional strip at the city’s core.
Women in areas with the best socioeconomic indicators could expect to live 2 to 3 years longer than women in the most disadvantaged areas, while the difference for men was 5 to 6 years. Table three reports slope indices of inequality in life expectancy across CABA areas, separately for women and men at ages twenty, forty, and sixty.
The authors modeled each small-area characteristic separately after transforming it into deciles; the index represents the mean life-expectancy difference between areas in the tenth and first deciles. For the composite Z-score, estimates range from two point seventy-three years for women at age twenty to five point forty-three years for men, with ninety-five percent confidence intervals shown in parentheses.
A major strength was using all deaths registered in CABA during a three-year period: more than 88,000 deaths, all georeferenced to small areas with an average area size of 0.58 square kilometers. The Bayesian application of the TOPALS method allowed the study to obtain precise and reliable life expectancy estimates.
A limitation was reliance on the 2010 census for socioeconomic variables because census data are updated every decade and the 2020 census had not been carried out. The time difference between the 2010 census and georeferenced deaths from 2015 to 2017 could bias the results.
The study found wide within-city spatial and socioeconomic heterogeneities in life expectancy across small areas of one of Argentina’s wealthiest cities. These heterogeneities are driven by modifiable factors that could potentially be addressed through oriented place-based policies, including community gender-based interventions.
Life expectancy varied sharply across Buenos Aires, following a clear north–south pattern and strong socioeconomic gradients. The findings support place-based policies aimed at the conditions shaping health in neighborhoods.
A derivative work by Paperi · AI-generated script, voice and captions
· pages and figures unaltered
Made with Paperi.
Drop in a research PDF — get a narrated video walkthrough like this one,
with highlights that follow the narration. Free to start.
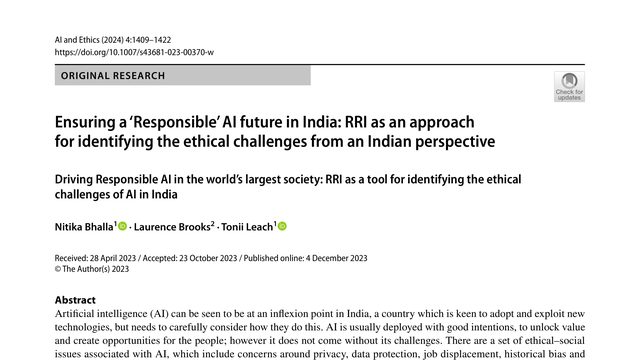
India is rushing toward artificial intelligence, but the people most affected may not be the people deciding how it is used. This study asks a practical question: how can India spot the risks before they become everyday harm?India is adopting AI at enormous scale, but this study argues that the hardest problem is not simply building better systems. It is identifying whose interests those systems serve, and who may be left out.
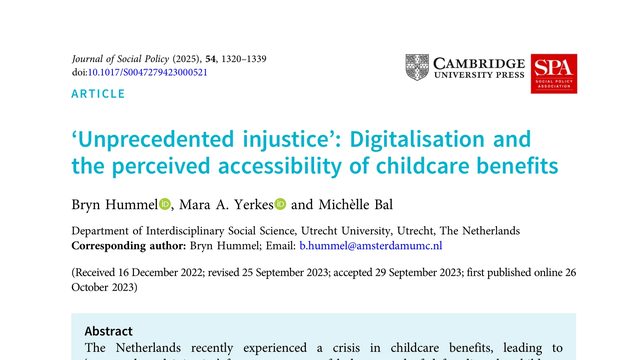
A benefit can exist on paper and still feel out of reach. In the Netherlands, parents with more education actually reported lower access to childcare benefits, a result that turns the usual story about inequality upside down.A benefit designed to make childcare affordable can become harder to reach when the application itself is digital, complex, and treated as the parent’s responsibility. This study asks whether literacy helps explain who feels able to access it.
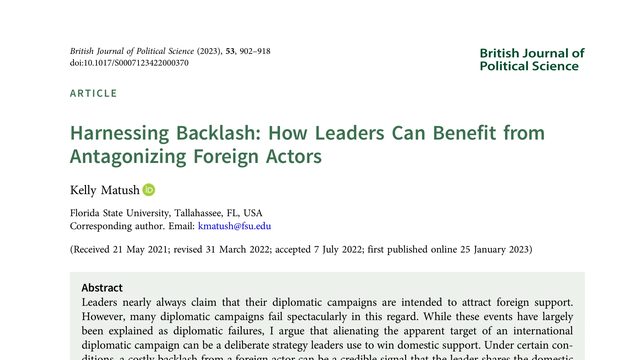
What if a leader angers a powerful foreign partner not by accident, but to prove loyalty to voters back home? This paper argues that a diplomatic backlash can sometimes be politically useful.What if a diplomatic backlash is not a failure, but the point? This paper argues that leaders can trade foreign condemnation for domestic support when the right voters are watching.
 4:45