Validation of a novel numerical model to predict regionalized blood flow in the coronary arteries
Student8:51CCAI
paperi.ai
0:00 / 0:00
Daniel J. Taylor, Jeroen Feher, Krzysztof Czechowicz, Ian Halliday, D. Rodney Hose, Rebecca Gosling, Louise Aubinière-Robb, Marcel van’t Veer, Danielle Keulards, Pim A.L. Tonino, Michel Rochette, Julian Gunn, Paul Morris
What if an angiogram could do more than show where a coronary artery narrows? This study tests whether a numerical model can estimate how blood flow is distributed along the artery—and into its side branches.
Ischaemic heart disease results from insufficient coronary blood flow. Direct measurement of absolute flow (mL/min) is feasible, but has not entered routine clinical practice in most catheterization laboratories. Interventional cardiologists, therefore, rely on surrogate markers of flow. Recently, we described a computational fluid dynamics (CFD) method for predicting flow that differentiates inlet, side branch, and outlet flows during angiography. In the current study, we evaluate a new method that regionalizes flow along the length of the artery. ............................................................................................................................................................................................. Three-dimensional coronary anatomy was reconstructed from angiograms from 20 patients with chronic coronary syndrome. All flows were computed using CFD by applying the pressure gradient to the reconstructed geometry. Side branch flow was modelled as a porous wall boundary. Side branch flow magnitude was based on morphometric scaling laws with two models: a homogeneous model with flow loss along the entire arterial length; and a regionalized model with flow proportional to local taper. Flow results were validated against invasive measurements of flow by continuous infusion thermodilution (Coroventis™, Abbott). Both methods quantified flow relative to the invasive measures: homogeneous (r 0.47, P 0.006; zero bias; 95% CI −168 to +168 mL/min); regionalized method (r 0.43, P 0.013; zero bias; 95% CI −175 to +175 mL/min). During angiography and pressure wire assessment, coronary flow can now be regionalized and differentiated at the inlet, outlet, and side branches. The effect of epicardial disease on agreement suggests the model may be best targeted at cases with a stenosis close to side branches.
Transcript
What if an angiogram could do more than show where a coronary artery narrows? This study tests whether a numerical model can estimate how blood flow is distributed along the artery—and into its side branches. Ischaemic heart disease results from insufficient coronary blood flow, while direct measurement of absolute flow is feasible but has not entered routine clinical practice in most catheterization laboratories.
Interventional cardiologists therefore rely on surrogate markers of flow. A previously described computational fluid dynamics method predicted flow and differentiated inlet, side branch, and outlet flows during angiography.
This study evaluates a new method that regionalizes flow along the length of the artery. The novel method attempts to correlate side branch flow leak to areas of significant bifurcation, representing the pattern of flow commonly encountered in real coronary arteries.
The method was validated against continuous infusion thermodilution measurements and compared with results from the homogeneous computational fluid dynamics method. Two angiographic projections of the vessel of interest, acquired at least thirty degrees apart during end-diastole, were used to reconstruct coronary anatomy.
Image selection and correction for table movement were performed manually, while centreline tracing and vessel border detection were performed semi-automatically, with manual correction when required. A rigid, three-dimensional, axisymmetric geometry representative of patient anatomy was then automatically created.
The inlet corresponded to the locations of invasive flow and aortic pressure measurement, while the outlet corresponded to the location of distal pressure measurement; invasive pressure readings defined the inlet and outlet boundary. Side branch flow was simulated by modelling arterial reconstructions with a porous wall boundary, allowing flow loss from the main vessel lumen.
For all circumstances, inlet flow equals outlet flow plus side branch flow. Side branch magnitude was inferred from taper of the main vessel using Murray’s law, which relates the diameters of parent and daughter branches around a bifurcation.
From the original forty-eight cases, twenty-seven cases from twenty patients yielded full physiological datasets. Cases were excluded for insufficient angiographic quality or pressure data, insufficient angiographic projections, unsuitable patient anatomy, coronary intervention before flow measurement, or major side branches close to the Rayflow catheter.
Seven patients, or thirty-five percent, were male; mean age was sixty-two years, and mean body mass index was twenty-five point two kilograms per square metre. Figure one starts with a reconstructed coronary artery and contrasts two ways of simulating side-branch losses, shown by the blue arrows.
In the homogeneous method, leakage is distributed along the vessel, so total flow is largely agnostic to local radius changes. In the regional method, losses depend on local vessel radius, and no flow is leaked where the downstream radius recovers—representing a stenosis rather than healthy taper.
Table one lists reconstructed vessel characteristics and flow estimates for eighteen LAD, seven LCx, and two RCA arteries. For each case, it places FFR and stenosis from operator, two-dimensional, and three-dimensional QCA alongside catheter-measured and CFD-derived coronary flow and microvascular resistance.
This case-by-case view matters because the reported agreement analyses link discrepancies between methods to FFR, translesional pressure drop, and stenosis, rather than treating every vessel as equivalent. The homogeneous porous wall boundary method produced a mean computational flow of two hundred nineteen millilitres per minute, with a standard deviation of eighty-six millilitres per minute.
There was a statistically significant correlation between computational flow and continuous infusion thermodilution flow, with a correlation coefficient of zero point four seven three and a P value of zero point zero zero six. Figure two compares simulated flow, QCFD, with pressure-wire flow, QCIT, using correlation plots in panels A and C and Bland–Altman agreement plots in panels B and D.
The homogeneous method shows a significant correlation, with a mean difference of zero and ninety-five percent limits of agreement from minus one hundred seventy-five to plus one hundred seventy-five millilitres per minute. The regional method is assessed with the same visual framework, supporting the authors’ evaluation of whether regionalizing flow preserves agreement with measurements.
Figure three compares RmicroCFD with RmicroCIT using two complementary analyses for homogeneous and regional porous-wall methods. Passing–Bablok plots in panels A and C show the pairwise correlation, while Bland–Altman plots in panels B and D display differences against the measurements’ mean, making agreement and any systematic spread visible.
This matters because it evaluates whether the CFD-derived microvascular resistance tracks the catheter-laboratory CIT method. Table two reports Pearson correlations and p-values for agreement between CFD and thermodilution estimates, using homogeneous and regional arterial boundary methods.
For Q, agreement correlates with stenosis measures and pressure-wire results, including three-dimensional QCA at r equals 0.369 and 0.489, while FFR correlations are negative at minus 0.399 and minus 0.334. For R micro, stenosis measures show no statistically significant correlations, whereas pressure drop and FFR do, indicating different relationships for flow and microvascular resistance estimates.
Certain patient and vessel characteristics influenced agreement between computational fluid dynamics and invasive measurements. For both homogeneous and regional porous wall boundary methods, flow agreement correlated with translesional pressure drop, fractional flow reserve, and percentage stenosis assessed by two-dimensional and three-dimensional quantitative coronary angiography.
For both techniques, agreement between computational flow and continuous infusion thermodilution improved in cases with greater disease burden assessed by pressure wire studies, two-dimensional quantitative coronary angiography, and three-dimensional quantitative coronary angiography.
For the regional method, flow agreement also correlated with visually assessed stenosis. The regionalized porous wall boundary method was validated for simulating side branch flow and compared with the original homogeneous method, with the main aim of regionalizing side branch and main branch flow.
Regionalization was achieved with no major difference in overall side branch flow compared with the homogeneous method. The new regionalized method correlated with continuous infusion thermodilution measurements, with zero bias and ninety-five percent limits of agreement of plus or minus one hundred seventy-five millilitres per minute.
Agreement with invasive clinical measures was suboptimal, which was attributed to inclusion of several INOCA cases with minimal stenosis and pressure gradient. The regional porous wall boundary method showed moderate correlation between continuous infusion thermodilution and computational flow, with ninety-five percent limits of agreement of plus or minus one hundred seventy-five millilitres per minute.
These limits of agreement were larger than those reported in previous studies of different datasets, even when accounting for the larger mean flow of patients included in the current study. The characteristics of included arteries were identified as the most likely important factor that negatively influenced agreement.
Computational flow accuracy is critically dependent upon agreement between simulated flow patterns and those occurring in vivo. The regionalized model captured coronary flow with moderate correlation and zero bias, but its agreement was still limited. Its strongest potential may be in arteries where a stenosis lies close to important side branches.
A derivative work by Paperi · AI-generated script, voice and captions
· pages and figures unaltered
Made with Paperi.
Drop in a research PDF — get a narrated video walkthrough like this one,
with highlights that follow the narration. Free to start.
When cancer reaches bone, the consequences can be devastating: pain, fractures, loss of movement, and sometimes death. To understand how that journey happens—and how to stop it—researchers build living models of it.Cancer cells do not simply appear in bone: they invade, enter circulation, and adapt to a new tissue. This review shows how animal models try to recreate that journey—and where the imitation breaks down.
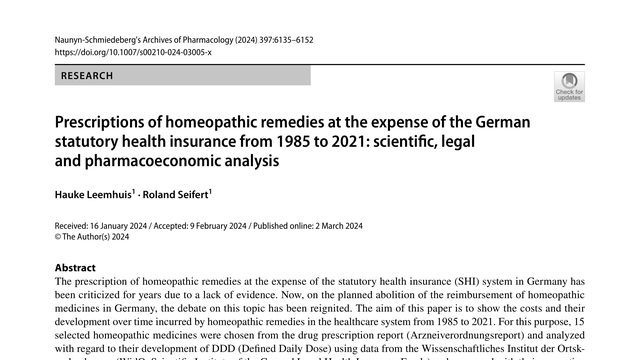
When public health insurance pays for a treatment, the question is not only whether people want it. It is whether the evidence, the price, and the safety information justify using everyone’s shared money.Germany’s statutory health insurance spent millions on homeopathic and anthroposophical remedies, even as the evidence base remained weak. This study asks what happened to the costs, the claims, and the legal standards over time.
In type 1 diabetes, insulin-making cells may not only be attacked by the immune system—they may also be destroyed by a chain reaction involving iron and damaged fats. Blocking that reaction helped preserve signs of pancreatic health in diabetic mice.What if insulin-producing beta cells in type 1 diabetes are not dying only through the usual pathways, but through an iron-driven process that can be blocked? This study tests that possibility in diabetic mice.
 4:28
4:28