Understanding ongoing processes of terrestrial mud diapirism through absolute gravimetry and geodetic approaches in SW Taiwan: implications for geological hazards
What if the ground is gaining mass from below, even without a dramatic eruption? At a Taiwanese mud volcano, gravity measurements reveal a persistent increase that ordinary surface observations cannot explain.
Mud diapirs and mud volcanoes are widespread geological features driven by subsurface seepage or extrusion of liquid and over-pressured mudstone. These formations pose significant hazards due to the emission of flammable gases, formation of mudflows, and release of atmospheric methane. In southwestern Taiwan, mud diapirism is a complex process involving multiple factors, including regional tectonics and geological history. Despite its significance, the contribution of mud diapirism to present-day crustal deformation during ongoing orogeny and its involvement in hazard assessments are still unclear. This study presents a comprehensive investigation of subsurface mass redistribution using a combination of absolute gravimetry and geodetic approaches at a site near Wandan mud volcano in southwestern Taiwan. High-precision time-lapse gravity data collected over 5 years reveal a significant linear trend of +2.891 ± 0.618 μGal/year, with hydrology-induced effects around 0.807 ± 0.054 μGal/year. Geodetic measurements reveal a slight uplift, which results in a gravity decrease rate of −0.010 μGal/year. These suggest that subsurface mass addition is the most plausible explanation for the net gravity increase rate of +2.073 μGal/year. Forward modeling under assumptions identifies critical values for key parameters of a mud diapir (size, depth, and intruding rate) required to produce the observed gravity increase rate on the surface: a radius of 50 m or greater and an intruding rate of 0.409 m/year or larger. These critical values found are in line with other studies and significantly narrow down the possible parameter space. Our findings suggest that subsurface mass addition is a significant factor and should be considered in the models for studies of the development of the fold-and-thrust belt in southwestern Taiwan. The results provide new insights into the activity of mud diapirism and highlight the importance of combining absolute gravimetry and geodetic approaches in addressing such processes.
Transcript
What if the ground is gaining mass from below, even without a dramatic eruption? At a Taiwanese mud volcano, gravity measurements reveal a persistent increase that ordinary surface observations cannot explain. Mud diapirs and mud volcanoes are widespread manifestations of mobile shale, with more than one thousand eight hundred occurrences globally, especially in compressional tectonic environments with rapid sedimentation.
A mud diapir is an intrusive body of shale or clay that may or may not reach the surface, while a mud volcano is the surface expression of mud originating from depth. These systems can threaten communities through flammable gas emissions and mudflows, and uneven uplift from diapirism has threatened buildings and highways in southwestern Taiwan.
The central problem is that mud diapirism's contribution to present-day crustal deformation in southwestern Taiwan and its associated hazard potential remain unclear. The Wandan mud volcano, also known as Liyushan mud volcano, has been active in Taiwan since eruptions recorded as early as seventeen twenty-two.
It still erupts frequently and relatively steadily, at intervals of four to eleven months, suggesting ongoing mass redistribution. The site is useful because no reverse fault is nearby, helping eliminate a possible tectonic contribution to the gravity data. Continuous Global Navigation Satellite System stations, benchmarks, and borehole wells also allow corrections for vertical motion and hydrology, helping isolate mass redistribution associated with mud volcano activity.
Southwestern Taiwan sits in an ongoing arc-continent collision zone, and a fold-and-thrust belt model has been proposed for the region's tectonic escape. However, Global Navigation Satellite System velocity gradients show a discrepancy with that model, and an unknown active source may dominate modern crustal deformation.
Terrestrial mud diapirs are observed intruding thick mudstone along major anticlines in the southwestern Taiwan fold-and-thrust belt. How those diapirs interact with present-day crustal deformation remains poorly understood, limiting efforts to refine tectonic models and hazard assessments.
The study uses different geodetic approaches to monitor possible mass redistribution at Wandan mud volcano. These approaches cover both the physical and geometric properties of the mud volcano. Time-lapse absolute gravity measures the physical signal, while precise leveling and continuous Global Navigation Satellite System stations monitor vertical deformation of the land.
Groundwater and tectonic effects are also considered as factors that can affect gravity. A time-lapse gravity campaign was conducted in the Wandan mud volcano area between twenty-fifteen and twenty-twenty using a Micro-g F-G five absolute gravimeter.
An absolute gravity control point called W-D-A-G was established in the basement of a reinforced concrete building. Panel a places WDAG beside the Wandan mud-volcano craters, along the Fengshan fault and near the Gaoping River, while PTUN and R200 lie farther north.
Panel b shows the resulting hazard directly: a bean field covered by gray mud and disrupted by cracked, dried ground; panel c shows the FG-five instrument used at the control point. The gravimeter repeatedly drops a test mass through a vacuum chamber, while a laser interferometer tracks its position and an atomic clock measures travel time to calculate gravity.
Every thirty minutes, the instrument produces an average gravity value using least squares with outliers removed. Each time-lapse measurement uses fifteen hours of continuous observation, with estimated precision at the level of a few microgals. Nighttime observations and the absence of eruptions helped minimize environmental, human-induced, and short-period mud-volcano interference.
A weighted least-squares fit of the absolute gravity time series shows a significant increasing trend of two point eight nine one plus or minus zero point six one eight microgals per year. The square of the correlation coefficient is around zero point six seven, indicating how much variation the linear model explains.
The zero-trend null hypothesis was tested against the alternative that the trend was not zero. The test statistic is four point six eight, beyond the five-percent confidence threshold from minus two point three six to plus two point three six, so the null hypothesis was rejected.
In the central plotting region, the residual-gravity points generally rise from negative values in the earlier years toward positive values near twenty twenty, although the error bars show noticeable scatter around that pattern. Red eruption ticks along the time axis mark several events during the observation period, including clusters near twenty eighteen and twenty nineteen.
A precise leveling network with fifteen benchmarks covered the Wandan mud volcano and its surrounding area. Repeated leveling campaigns were conducted annually in March from twenty-eighteen through twenty-twenty. Each campaign used a least-squares adjustment with a minimum constraint for the network.
Groundwater movement can disturb gravity measurements, so the groundwater signal needs to be removed before geological interpretation. The study analyzed daily average groundwater level from twenty-fifteen to twenty-twenty at the closest borehole, H-C-one, operated by Taiwan's Water Resources Agency.
Although H-C-one is approximately one point five kilometers from Wandan, it shares the same unconfined aquifer, and the two locations have minimal heterogeneity because of shared recharge-river interaction and similar hydraulic properties. Only the unconfined aquifer's hydraulic head was considered because recharge and discharge water mass can cause gravity change, unlike pressurized aquifers.
In panel a, the strongest negative velocities cluster in the blue-shaded coastal zone southwest of WDAG, while the reference benchmarks R200 and SZ13 sit near areas with much weaker shading. The enlarged panel b makes the local contrast clearer: around WDAG and HC1, the contours transition from near-neutral values into progressively more negative colors toward the south.
Tests of discharge time constants from four hours to seven days found that the hydrology-induced gravity trend reaches one point zero zero zero microgals per year when the discharge time is about forty hours. Because the geology near Wandan includes gravel and medium to coarse sandstone, that discharge time is not considered uncommon.
Even so, the hydrology-induced effect is unlikely to explain the observed gravity increase of two point eight nine one microgals per year. In panels b and c, the blue curves show closely matching seasonal and episodic fluctuations, including sharp peaks around late twenty sixteen and late twenty eighteen.
The red fitted lines are also nearly parallel, with panel c visibly offset slightly above panel b toward the end of the record. After accounting for tidal, barometric, elevation, tectonic, and aquifer-replenishment effects, the remaining absolute-gravity time series can be attributed to mud diapir intrusion.
Forward modeling then simulates hypothetical intrusion scenarios to examine their contribution to the observed gravity increase. Because many possible solutions could produce the increase, the study uses simplified hypothetical scenarios to provide approximate overviews for future interpretation.
Accounting for vertical motion and using the Bouguer model for hydrology gives a net gravity increase rate of two point zero seven three microgals per year at W-D-A-G. The long-term trend is modeled as continuous, although actual mud intrusion may occur discretely.
A simple intrusion mechanism would lift overlying material and create obvious dome-shaped surface deformation, but Wandan is a mud-pie-type mud volcano without significant dome-shaped deformation. Precise leveling results also confirm the lack of significant dome-shaped deformation.
The alternative model assumes that viscous mud intrudes through fractured media and fills fracture space previously occupied by groundwater. Porosity represents the volumetric ratio of void volume to bulk sediment volume, with the voids treated as scattered slits, fractures, or conduits.
In panel a, the labeled radius, thickness, and distance from gravimeter FG-five define the cylindrical geometry, with an upward arrow marking growth at the top boundary. In panel b, the dashed new boundary cuts through blue water-filled fractures, while the green mud occupies lower fracture pathways between the old and new boundaries.
The modeled critical boundary requires a mud diapir radius of at least fifty meters and an intruding rate of zero point four zero nine meters per year or larger to reach the observed surface gravity increase. The parameter range is consistent with reported active mud volcano systems worldwide.
Figure six uses forward modeling to test how mud intrusion rate, cylinder radius, density contrast, and depth affect the surface gravity increase. Panels a and c show that, for a radius of fifty meters or a rising rate of zero point four zero nine meters per year, some cases reach the observed threshold of two point zero seven three microgals per year, while others do not; panel b shows the gravity rate scaling down with fifty percent of the density contrast.
Panel d summarizes the depth limits for successful combinations, supporting the authors’ stated minimum radius and intrusion-rate conditions. Hydrology-induced gravity effects were examined with both a Bouguer plate model and a conceptual bucket model that includes recharge and discharge parameters.
The Bouguer model gives a gravity trend of zero point eight zero seven plus or minus zero point zero five four microgals per year. The bucket model reaches one microgal per year when the discharge time is approximately forty hours. Further hydrogeological information is needed to refine the discharge-time estimate, but both models are unlikely to overshadow the gravimeter's gravity increase.
After removing vertical-motion effects and approximating hydrology with the Bouguer approach, the remaining gravity increase is plus two point zero seven three microgals per year. Although the result comes from a single absolute-gravity site, its magnitude and persistence cannot be attributed to known hydrological or tectonic processes, making subsurface mass addition the most plausible explanation.
The forward model considers intrusion size, depth, and intruding rate, and identifies critical values capable of producing the observed surface gravity increase. Under the assumptions, the radius must be at least fifty meters and the intruding rate must be zero point four zero nine meters per year or larger; these limits narrow the feasible parameter space.
Mud diapirism in southwestern Taiwan is complex and understudied, partly because widespread mobile shales make seismic reflection images difficult to interpret. Combining time-lapse gravimetry with geodetic approaches provides substantial observations consistent with mass increase at Wandan.
Forward modeling quantifies possible intrusion scenarios and offers explanations for mud-diapir activity. Subsurface mass addition should be included in future fold-and-thrust-belt models, while further geophysical data are needed; if mass addition continues at its present rate, associated hazards may be amplified.
The measurements point to subsurface mass addition beneath Wandan as the most plausible explanation for the gravity increase. That matters because continued addition could amplify geological hazards in southwestern Taiwan.
A derivative work by Paperi · AI-generated script, voice and captions
· pages and figures unaltered
Made with Paperi.
Drop in a research PDF — get a narrated video walkthrough like this one,
with highlights that follow the narration. Free to start.
Qi Li, Bin Ji, Wencai Zhang, Rick Q. Honaker, Xinbo Yang, James C. Hower
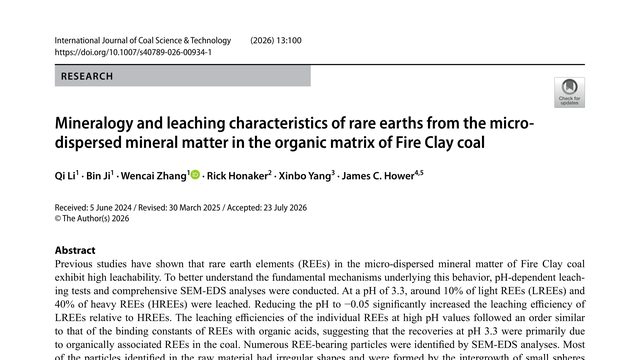
Coal is usually burned for energy, but it can also hide rare earths, materials needed in many modern technologies. The surprise is that the easiest ones to release are not distributed evenly: acidity changes which rare earths come out.Fire Clay coal releases rare earth elements in two distinct ways: some are easily leached from organic associations, while others require extreme acidity to dissolve the tiny minerals dispersed through the coal.
Huaiyu Tang, KERRY E. SIEH, Yu‐Ming Lai, Brian R. Jicha, Kwan‐Nang Pang
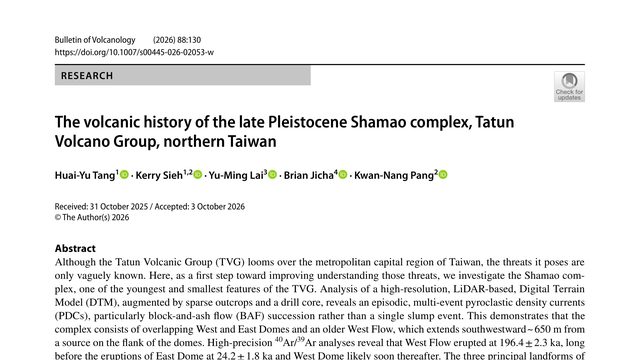
A volcano beside Taiwan’s capital may look like one old mound. This study finds it is a layered record of separate eruptions, separated by roughly 170,000 years.Under Taipei’s skyline sits a volcanic complex that looked, at first glance, like one slump. The evidence instead reveals multiple dome-building episodes, repeated collapses, and eruptions separated by roughly 170,000 years.
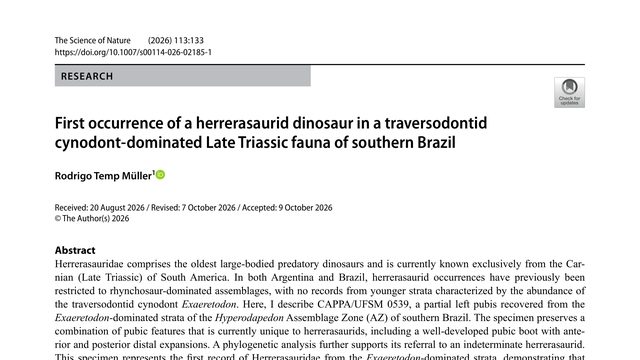
A single partial pelvic bone has revealed that one of the earliest large meat-eating dinosaurs survived a major change in its ancient community, and may be the youngest member of its group ever found.A single, fragmentary dinosaur bone from Brazil may show that one of the Triassic’s oldest predators survived a major ecological turnover, and could even be the youngest herrerasaurid ever found.
 3:45