Integrating the Soil Microbiota and Metabolome Reveals the Mechanism through Which Controlled Release Fertilizer Affects Sugarcane Growth
Overview5:06CCAI
paperi.ai
0:00 / 0:00
Zhaonian Yuan, Qiang Liu, Lifang Mo, Ziqin Pang, Chaohua Hu
More fertilizer does not necessarily mean more sugar. This study found that sugarcane did best when nutrients arrived at the right pace, apparently by changing the living community and chemical signals around its roots.
Root−soil underground interactions mediated by soil microorganisms and metabolites are crucial for fertilizer utilization efficiency and crop growth regulation. This study employed a combined approach of soil microbial community profiling and non-targeted metabolomics to investigate the patterns of root-associated microbial aggregation and the mechanisms associated with metabolites under varying controlled-release fertilizer (CRF) application rates. The experimental treatments included five field application rates of CRF (D1: 675 kg/ha; D15: 1012.5 kg/ha; D2: 1350 kg/ha; D25: 1687.5 kg/ha; and D3: 2025 kg/ha) along with traditional fertilizer as a control (CK: 1687.5 kg/ha). The results indicated that the growth of sugarcane in the field was significantly influenced by the CRF application rate (p < 0.05). Compared with CK, the optimal field application of CRF was observed at D25, resulting in a 16.3% to 53.6% increase in sugarcane yield. Under the condition of reducing fertilizer application by 20%, D2 showed a 13.3% increase in stem yield and a 6.7% increase in sugar production. The bacterial ACE index exhibited significant differences between D25 and D1, while the Chao1 index showed significance among the D25, D1, and CK treatments. The dominant bacterial phyla in sugarcane rhizosphere aggregation included Proteobacteria, Actinobacteriota, and Acidobacteriota. Fungal phyla comprised Rozellomycota, Basidiomycota, and Ascomycota. The annotated metabolic pathways encompassed biosynthesis of secondary metabolites, carbohydrate metabolism, and lipid metabolism. Differential analysis and random forest selection identified distinctive biomarkers including Leotiomycetes, Cercospora, Anaeromyxobacter, isoleucyl-proline, and methylmalonic acid. Redundancy analysis unveiled soil pH, soil organic carbon, and available nitrogen as the primary drivers of microbial communities, while the metabolic profiles were notably influenced by the available potassium and phosphorus. The correlation heatmaps illustrated potential microbial−metabolite regulatory mechanisms under CRF application conditions. These findings underscore the significant potential of CRF in sugarcane field production, laying a theoretical foundation for sustainable development in the sugarcane industry.
Transcript
More fertilizer does not necessarily mean more sugar. This study found that sugarcane did best when nutrients arrived at the right pace, apparently by changing the living community and chemical signals around its roots. Sugarcane is the world's most important sugar crop, but its long growing season requires a large and continuous supply of fertilizer.
That raises cultivation costs for farmers and weakens economic benefits. The challenge is therefore not simply growing more cane; the long growing season demands continuous fertilizer, increasing cultivation costs and reducing farmers’ economic benefits.
Controlled-release fertilizer releases nutrients slowly and continuously to support plant growth. Compared with traditional fertilizer, it releases nutrients at a stable rate over time through special packaging materials. That steadier supply can meet plant needs while reducing nutrient wastage and environmental pollution.
Studies have also linked suitable use with better nutrient use, yield, and crop quality. The central question is how this approach works in sugarcane soil, where soil metabolites and microorganisms may act together under controlled release fertilizer.
The amount of controlled-release fertilizer significantly affected sugarcane growth in the field. The highest fertilizer rate produced the most cane stems, but the highest sugar yield came from a moderate rate called D25. Plant height and stem thickness peaked under different rates, while sucrose content peaked under moderate D25 conditions.
In other words, more stems did not automatically mean more sugar. For better sugar yield and economic returns, D25 was identified as the effective threshold for applying controlled-release fertilizer. The soil around sugarcane roots contains communities of bacteria and fungi, and fertilizer changed some of those communities.
Bacterial diversity differed between fertilizer treatments, while fungal diversity stayed largely unchanged as the rate changed. The bacterial balance also shifted in relative abundance: Proteobacteria decreased under D two, while Actinobacteriota, Firmicutes, and another bacterial phylum increased.
In the fungal community, Basidiomycota decreased when CRF exceeded 1350 kilograms per hectare, while Rozellomycota increased notably under D two compared with other fertilizer rates. This is like adjusting the food arriving at a shared kitchen: change the delivery schedule, and different residents become more or less able to thrive.
The soil is not passive; its living community responds to the fertilizer schedule. The sugarcane root zone contains shifting communities of bacteria and fungi, while its soil chemicals span many biological jobs. That matters because changing fertilizer can reshape both the living community and the chemical processes surrounding the roots.
The main forces shaping the bacterial community were soil acidity, available nitrogen, and soil organic carbon. Which soil nutrients mattered most varied with the amount of controlled-release fertilizer applied. That means the fertilizer rate was connected to the soil conditions that organize the root-zone bacterial community, rather than acting as an isolated input.
The study used heatmaps to examine relationships among bacteria, fungi, and metabolites, and found significant concomitant relationships in sugarcane rhizosphere soils. For example, the dominant bacterium Sphingomonas had a significant negative relationship with several dominant fungal groups.
When one part of this underground community changed, another part tended to change with it. Changing the fertilizer reshaped the sugarcane root-zone community at several levels: particular bacteria, fungi, and small chemical compounds varied together.
This matters because it points to a connected underground response, rather than a change in one isolated group. The strong sugarcane yields led to a closer look at the microorganisms and soil chemicals involved under different fertilizer rates. The study recommends D25 when the goal is to maximize sugar yield and economic returns.
The chemical analysis linked controlled-release fertilizer with substances involved in sugarcane production, growth regulation, and interactions among microorganisms that affect fertilizer breakdown and use in the soil. For a farmer, the practical recommendation is to apply controlled release fertilizer under D twenty-five conditions to maximize sugar yield and economic returns.
Controlled-release fertilizer can improve sugarcane production by coordinating nutrient delivery with changes in the soil life around roots. The practical target is not the biggest dose, but the rate that produces the most sugar and better returns.
A derivative work by Paperi · AI-generated script, voice and captions
· pages and figures unaltered
Made with Paperi.
Drop in a research PDF — get a narrated video walkthrough like this one,
with highlights that follow the narration. Free to start.
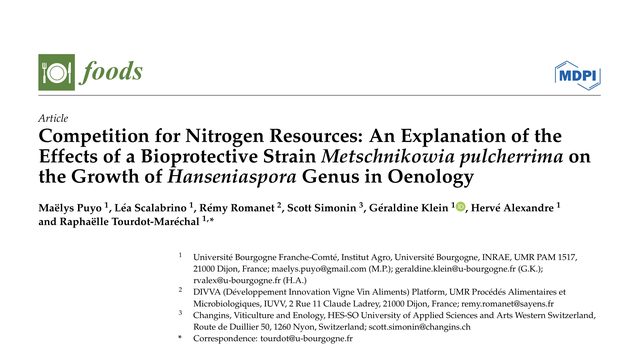
A natural yeast added to grape juice can protect the future wine from unwanted microbes, but only against some of them. The surprising reason may be a struggle over the same basic food: nitrogen.A protective yeast is supposed to suppress unwanted microbes, but here, it worked against one Hanseniaspora species and failed against another. The clue points not to oxygen, but to a race for nitrogen resources.
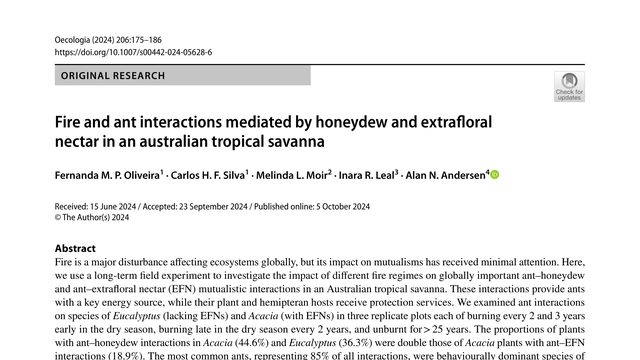
Fernanda M. P. Oliveira, Carlos H. F. Silva, Melinda L. Moir, Inara R. Leal, Alan N. Andersen
Fire usually sounds like a force that breaks relationships in nature. But in this Australian savanna, frequent burning helped plants and ants connect more often, and brought more of the most protective ants into the picture.Fire usually sounds destructive, but in this Australian savanna it increased some ant partnerships, especially ants visiting plant nectar, and increased the share of dominant, high-quality mutualists.
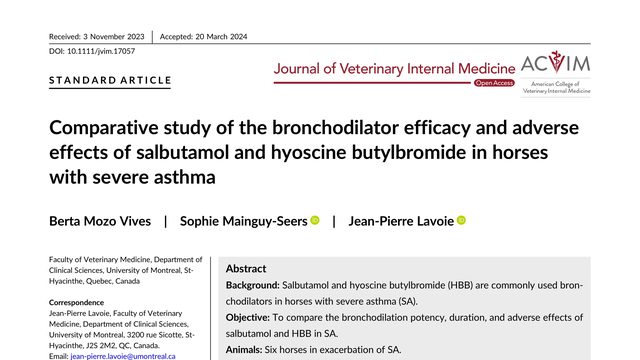
Berta Mozo Vives, Sophie Mainguy‐Seers, Jean‐Pierre Lavoie
When a horse cannot breathe, two medicines can open its narrowed airways quickly. But the treatment that lasts longer may also be the one that avoids problems with the heart and gut.Two drugs can open a horse’s airways with similar strength, but one lasts up to three hours while the other lasts about one, and the shorter-acting option is the one linked to faster heart rates and quieter gut sounds.
 4:21
4:21