Reinforced Labels: Multi-Agent Deep Reinforcement Learning for Point-Feature Label Placement
Overview3:26CCAI
paperi.ai
0:00 / 0:00
Petr Bobák, Ladislav Čmolík, Martin Čadík
A map can spend half its production time deciding where words should go. This study teaches each label to move out of the way of the others, and the result is more complete, clearer maps, at a steep cost in time.
Over the recent years, Reinforcement Learning combined with Deep Learning techniques has successfully proven to solve complex problems in various domains, including robotics, self-driving cars, and finance. In this paper, we are introducing Reinforcement Learning (RL) to label placement, a complex task in data visualization that seeks optimal positioning for labels to avoid overlap and ensure legibility. Our novel point-feature label placement method utilizes Multi-Agent Deep Reinforcement Learning to learn the label placement strategy, the first machine-learning-driven labeling method, in contrast to the existing hand-crafted algorithms designed by human experts. To facilitate RL learning, we developed an environment where an agent acts as a proxy for a label, a short textual annotation that augments visualization. Our results show that the strategy trained by our method significantly outperforms the random strategy of an untrained agent and the compared methods designed by human experts in terms of completeness (i.e., the number of placed labels). The trade-off is increased computation time, making the proposed method slower than the compared methods. Nevertheless, our method is ideal for scenarios where the labeling can be computed in advance, and completeness is essential, such as cartographic maps, technical drawings, and medical atlases. Additionally, we conducted a user study to assess the perceived performance. The outcomes revealed that the participants considered the proposed method to be significantly better than the other examined methods. This indicates that the improved completeness is not just reflected in the quantitative metrics but also in the subjective evaluation by the participants.
Transcript
A map can spend half its production time deciding where words should go. This study teaches each label to move out of the way of the others—and the result is more complete, clearer maps, at a steep cost in time. Labels add an informational layer to a visualization, such as a map where cities, highways, and bodies of water are marked.
But placing those words by hand can take up to half of the map’s production time. The difficulty is not just finding a position for one label. Even simplified versions of the placement problem are extremely difficult, so real-world systems often search for workable positions rather than a perfect answer.
So the learned strategy treats label placement as a task in which experience guides future choices, rather than relying only on rules written by human experts. It is a machine-learning-driven approach to labeling. A compact neural network serves both as the system’s guide for choosing an action and as its estimate of how good that situation is.
The key idea is easier to picture in a crowded restaurant. Instead of giving one manager every table and every chair to track, each diner gets a small view of the nearby space and makes a local move. That division matters because the number of labels can change.
Each label can keep the same kind of local view and the same kind of action, while the number of label-agents changes with the scene. The goal is cooperation: every label should find a position that does not conflict with the others. The system therefore gives each label feedback about its own effort and feedback based on the entire environment.
A move can be judged locally, by what one label did, and globally, by how the whole arrangement turned out. Together, those signals encourage labels to make room for one another. Each label is controlled by its own decision-maker, all using the same network and only nearby information, so many labels can be adjusted at once.
During training, local and overall feedback teaches the network how far to move each label’s starting point to avoid conflicts. The comparison becomes harder as more anchors are added and the available space becomes more crowded. Across the tested settings, the compared methods followed the same broad trend as crowding increased.
That creates the real test: can the learned strategy preserve more readable labels when the scene gives every label less room to fit? The user study delivered the surprise: the learned method received the best quality score, significantly better than the other examined methods.
Users preferred its results. So the improvement was not only a count of placed labels. People looking at the arrangements also judged the learned method better than the alternatives. There is a clear trade-off.
The other methods compute faster but can leave an incomplete result, while the learned method takes several orders of magnitude longer and produces much more complete labeling. That makes the learned method a poor fit for instant, interactive views, but a strong fit for maps, technical drawings, and medical atlases prepared in advance, where missing labels matter more than waiting.
The learned strategy places more labels and is preferred by users, making it useful when a map, drawing, or medical atlas can be prepared ahead of time rather than assembled instantly.
A derivative work by Paperi · AI-generated script, voice and captions
· pages and figures unaltered
Made with Paperi.
Drop in a research PDF — get a narrated video walkthrough like this one,
with highlights that follow the narration. Free to start.
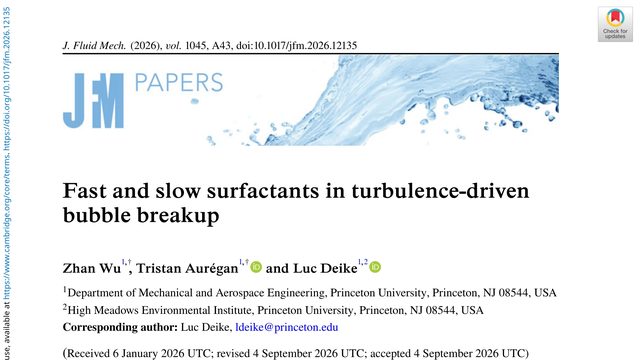
A stormy patch of water can make bubbles in two very different ways: surfactants may leave the larger bubbles untouched while creating up to five times as many tiny ones. The key is not just what the surfactant is, but how fast it arrives.A little chemistry can multiply the number of tiny bubbles produced when turbulence tears apart a large air cavity. But the surprise is that surface tension alone does not explain it: the surfactant's adsorption speed matters.
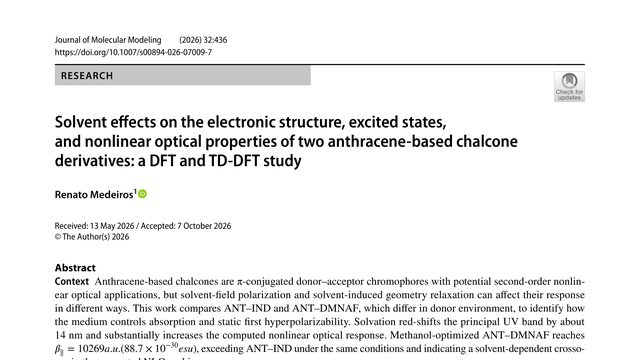
What if the liquid around a molecule could change not just how it absorbs light, but which of two molecules appears more powerful? This study finds that the answer can switch with the solvent.What happens when the same light-responsive molecule is placed in different solvents? In these anthracene-based chalcones, the solvent does more than shift an absorption peak, it can reverse which molecule has the stronger computed nonlinear optical response.
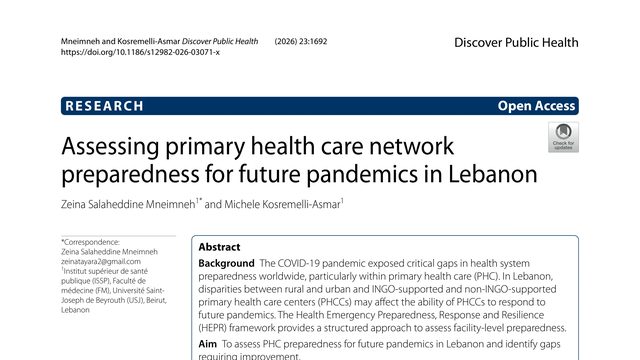
A health clinic can report a dangerous disease quickly and still be unprepared for the next pandemic. In Lebanon, that contradiction is exactly what this study uncovered.Lebanon’s primary care centers were very good at reporting disease, yet no center reported a formal way to systematically address community concerns. That contrast is the central surprise of this preparedness study.
 4:22
4:22