Modelling the historical distribution of schistosomiasis-transmitting snails in South Africa using ecological niche models
In depth14:15CCAI
paperi.ai
0:00 / 0:00
Nisa Ayob, Roelof Petrus Burger, Monray D. Belelie, Ncobile Nkosi, Henno Havenga, Lizaan de Necker, Dirk Cilliers
What if the geography of a disease could be reconstructed from old snail records and climate data? This study maps where South Africa’s schistosomiasis-transmitting snails were historically most likely to thrive.
Schistosomiasis is a vector-borne disease transmitted by freshwater snails and is prevalent in rural areas with poor sanitation and no access to tap water. Three snail species are known to transmit schistosomiasis in South Africa (SA), namely Biomphalaria pfeifferi, Bulinus globosus and Bulinus africanus. In 2003, a predicted prevalence of 70% was reported in tropical climates in SA. Temperature and rainfall variability can alter schistosomiasis-trans-mitting snails’ development by increasing or decreasing their abundance and geographical distribution. This study aimed to map the historical distribution of schistosomiasis from 1950 to 2006 in SA. The snail sampling data were obtained from the historical National Snail Freshwater Collection (NFSC). Bioclimatic variables were extracted using ERA 5 reanalysis data provided by the Copernicus Climate Change Service. In this study, we used 19 bioclimatic and four soil variables. The temporal aggregation was the mean climatological period pre-calculated over the 40-year reference period with a spatial resolution of 0.5˚ x 0.5˚. Multicollinearity was reduced by calculating the Variance Inflation Factor Core (VIF), and highly correlated variables (> 0.85) were excluded. To obtain an "ensemble" and avoid the integration of weak models, we averaged predictions using the True Skill Statistical (TSS) method. Results showed that the ensemble model achieved the highest Area Under the Curve (AUC) scores (0.99). For B. africanus, precipitation-related variables contributed to determining the suitability for schistosomiasis. Temperature and precipitation-related variables influenced the distribution of B. globosus in all three models. Biomphalaria pfeifferi showed that Temperature Seasonality (bio4) contributed the most (47%) in all three models. According to the models, suitable areas for transmitting schistosomiasis were in the eastern regions of South Africa. Temperature and rainfall can impact the transmission and distribution of schistosomiasis in SA. The results will enable us to develop future projections for Schistosoma in SA based on climate scenarios.
Transcript
What if the geography of a disease could be reconstructed from old snail records and climate data? This study maps where South Africa’s schistosomiasis-transmitting snails were historically most likely to thrive. Schistosomiasis is a parasitic infection caused by trematode worms belonging to the genus Schistosoma, and it is spread through vectors in mainly tropical and subtropical regions.
Freshwater snails are the intermediate hosts that transmit schistosomiasis to people and livestock. Schistosoma haematobium causes urogenital schistosomiasis and is transmitted by B. globosus and B.
africanus, while Schistosoma mansoni causes rectal and intestinal schistosomiasis and is transmitted by B. pfeifferi. Approximately 5 million South Africans living in poor rural areas lack access to clean water, and communities near rivers, ponds, lakes, and dams often become infected with schistosomiasis.
Among school-going children, prevalence ranges between 7.7 percent and 70 percent, with children appearing to have the highest prevalence of this infection. The suitable habitats where snail vectors thrive are tropical, humid, and aquatic environments such as dams and rivers, with mild to warm temperatures of 15 to 25 degrees Celsius and moderate to heavy rainfall events of 300 to 900 millimetres per year.
Ecological niche modelling has become increasingly popular because it can predict distributional ranges and identify which climatic and environmental variables shape species distributions. The approach has many methods, and each can produce a unique prediction and map using bioclimatic data.
The key problem is that no single approach is most effective for modelling the distribution of schistosomiasis. There have been few attempts to model the historical distributions of Schistosoma-transmitting snails in South Africa using environmental variables.
This study therefore used ecological niche models to simulate historical distributions of infected snails in South Africa and fill that knowledge gap. The models covered all three vectors of schistosomiasis: B. africanus, B.
globosus, and B. pfeifferi. Figure one maps historical sampling locations for three schistosomiasis snail vectors across South Africa. Orange points indicate B.
africanus, yellow points B. globosus, and red points B. pfeifferi, overlaid on rivers, water areas, and the national boundary. The map makes the geographic concentration and overlap of these potential intermediate hosts visible, providing spatial context for later analyses of habitat suitability and schistosomiasis transmission.
The occurrence data came from the historical National Snail Freshwater Collection from 1950 to 2006, with 15,303 records recorded. The original sampling points were stored in quarter-degree grids and were refined by digitising descriptions of the sampling points on a 1:50,000 topographical scale using ArcGIS 10.8.2.
The digitised locations were placed close to waterbodies including dams, rivers, reservoirs, lakes, and swamps, with latitude and longitude stored in decimal degrees using a WGS84 datum. Table one summarizes historical occurrence records for three snail vector species in South Africa, covering nineteen fifty to two thousand six.
It reports three thousand fifty-one points for Bulinus africanus, three thousand one hundred fifty-three for Bulinus globosus, and nine thousand one hundred sixty-six for Biomphalaria pfeifferi. These records came from the National Snail Freshwater Collection and provide the occurrence dataset later refined through digitizing, supporting the study’s analysis of species distributions and their environmental context.
The climate data came from ERA5 reanalysis data provided by the Copernicus Climate Change Service, and the study used 19 bioclimatic variables and four soil variables from 1970 to 2006. The variables describe how climate affects species’ habitats and can be used for biodiversity applications.
The temporal aggregation was a mean climatological period calculated over the 40-year reference period from 1979 to 2018, with a spatial resolution of 0.5 degrees by 0.5 degrees. The variable-selection step was designed to minimise collinearity, meaning strong relationships among predictors, in the dataset.
The USDM R package calculated the Variance Inflation Factor, or VIF, which measures the strength of the relationship between each predictor and the rest. As a rule of thumb, a VIF greater than 10 indicates a collinearity problem, and variables above 10 were removed using a threshold of 0.85.
Because of each species’ nature and distribution, each species had a unique set of environmental variables. Table three summarizes the three environmental niche models used in the study: GLM and RF, both listed as regression analysis, and MaxEnt, listed as maximum entropy.
All three use presence and pseudo-absence data, providing complementary approaches within the study’s multi-model species distribution framework. The authors then combine these algorithms in an ensemble model to represent schistosomiasis distribution.
The study used a multi-model species-distribution approach implemented in the SDM package, with dismo used to examine and model species distribution. Occurrence data were divided into two groups, with 70 percent used for training and 30 percent used for testing.
The analysis used 5,000 random pseudo-absence points, increased the maximum number of iterations to 5,000, and kept regularisation at 1 to reduce model overfitting. Higher AUC, ROC, and TSS values indicated better performance when evaluating the model predictions.
For TSS, a value of plus one indicates accurate classification, while a value of minus one indicates no better performance than random. For AUC, random predictions are represented by 0.5, predictions above 0.5 are better than the random model, and values above 0.9 are classified as extremely suited.
An ensemble model was developed from the results of the three models to model schistosomiasis distribution in South Africa. Ensemble models combine all algorithms, which improves performance, and all the models generated TSS values shown in Table 4. To create the ensemble, all three models were combined using weighted averaging with a TSS greater than 0.75.
Weighted averaging gives more weight to the model with higher accuracy than other techniques. Table four reports AUC and TSS for three snail species across GLM, MaxEnt, random forest, and ensemble models. These metrics matter because higher AUC and TSS indicate better predictive performance, while the ensemble combines the individual algorithms.
The ensemble models achieved the highest AUC scores, at 0.99, among the three ecological niche models. The evaluation showed that the model was based on competence rather than chance when modelling the historical distribution of schistosomiasis.
The high AUC value provides confidence that the ensemble model can be used to examine schistosomiasis-prone areas under current and future climates. For B. africanus, precipitation-related variables had the greatest influence on suitability for schistosomiasis, and most B.
africanus species thrive in rainfall environments. For GLM and MaxEnt, precipitation for the wettest quarter and precipitation for the wettest month accounted for 65 percent of suitability. Soil water for the wettest quarter contributed 32 percent to suitability for schistosomiasis.
Bulinus globosus distribution was significantly influenced by temperature and precipitation variables in all three models, with precipitation in the driest quarter and bio16 accounting for 41.7 percent of suitability. Temperature-related variables accounted for 38.3 percent of snail suitability, and the response curves showed an increasing trend in bio8.
In the MaxEnt model, temperature variables were the major contributors to B. globosus suitability; bio7 contributed 22.6 percent, followed by bio18 at 18.4 percent. Figure six shows how the random-forest response for Bulinus globosus changes across precipitation, temperature, and soil-water variables.
The curves are non-linear: responses shift sharply across parts of Bio15, Bio16, Bio17, Bio4, Bio7, Bio8, and soil water for the wettest quarter, rather than following a simple straight-line relationship. This matters because the authors identify precipitation in the driest quarter and Bio16 as accounting for forty-one point seven percent of infected-snail suitability, linking environmental variability to transmission risk.
For B. pfeifferi, temperature seasonality, or bio4, contributed the most: 47 percent in all three models. The GLM and MaxEnt models showed that B. pfeifferi prefers a climate with more variability in temperature throughout the year.
The response curves for bio12 and bio16 showed that Biomphalaria pfeifferi does not favour moderate to high rainfall. Based on GLM and MaxEnt, bio4 accounted for 46.9 percent of B. pfeifferi’s suitability. Figure ten maps where bioclimatic conditions favour Bulinus pfeifferi across South Africa, using four approaches: GLM, MaxEnt, random forest, and an ensemble model.
Across the panels, higher suitability is concentrated especially in the northeast and along parts of the coast, including KwaZulu-Natal and the Eastern Cape, while much of the interior appears lower suitability. The authors note that the figure also indicates potential transmission suitability in the Northern Cape, despite no snail vectors being sampled there, highlighting how climate-based models can identify areas requiring attention.
The ecological models were reasonably accurate at predicting the distribution of intermediate hosts based on bioclimatic variables. Precipitation and temperature are known factors in the development of intermediate snail hosts, and climate variability is integral to determining geographical distributions.
In the maps, red shows highly suitable areas, yellow depicts moderately suited locations, and green shows areas that are not suitable for schistosomiasis transmission. Snail presence probability varied with location, indicating varying suitability for B.
pfeifferi, B. globosus, and B. africanus. Figure eight maps where bioclimatic conditions favour Bulinus africanus across South Africa, using four approaches: GLM, MaxEnt, random forest, and an ensemble model.
Across the panels, suitability is shown from low in green to high in red, with stronger signals concentrated in eastern and northeastern regions and parts of the coast. The figure matters because it visualises the species’ predicted range under different modelling frameworks, supporting the authors’ discussion of its association with cooler environments and moderate rainfall.
Figure nine maps where bioclimatic conditions favour Bulinus globosus, using four approaches: GLM, MaxEnt, random forest, and an ensemble model. Across the panels, suitability is concentrated in eastern South Africa, especially Limpopo, Mpumalanga, Gauteng, eastern North West, and coastal KwaZulu-Natal, while much of the central and western country is shown as low suitability.
This matters because the pattern identifies regions where hotter temperatures and moderate rainfall may support this schistosomiasis intermediate host. According to the ensemble models, the most suitable areas for B. africanus, B.
globosus, and B. pfeifferi were found in the eastern and coastal regions of South Africa. The most suitable areas were tropical and rural areas of South Africa, also located close to freshwater bodies.
Results from ecological niche modelling showed that temperature and precipitation were essential factors in snail distribution. The study modelled the historical distribution of B. africanus, B. globosus, and B.
pfeifferi using ecological niche modelling. The ensemble models achieved the highest AUC scores, at 0.99, compared with GLM, MaxEnt, and RF. The models placed B. africanus in the eastern and northern parts of Gauteng province, Mpumalanga, and the North West Province.
Bulinus africanus cannot tolerate high temperatures, and temperature increases could lead to mortality of these intermediate hosts. Across the three snail species, ensemble models performed best, and the most suitable areas clustered in eastern and coastal South Africa. Temperature and rainfall emerged as central signals for understanding transmission risk.
A derivative work by Paperi · AI-generated script, voice and captions
· pages and figures unaltered
Made with Paperi.
Drop in a research PDF — get a narrated video walkthrough like this one,
with highlights that follow the narration. Free to start.
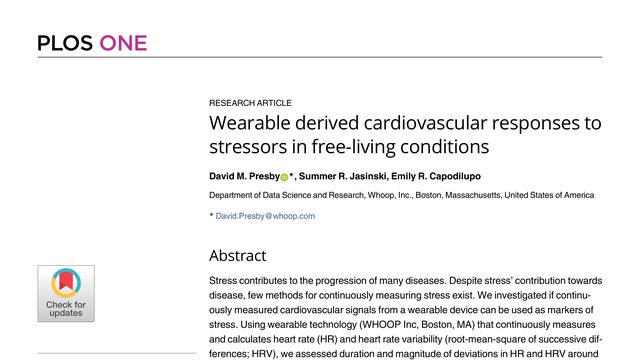
David M. Presby, Summer R. Jasinski, Emily R. Capodilupo
Stress does not necessarily end when the stressful moment ends. A wearable may be able to see the body remain changed long after a hard run or a tense period of work.Stress usually gets measured by asking questions, drawing blood, or using bulky clinical equipment. This study asks whether a wrist wearable can detect stressful events passively, simply by tracking heart rate and heart rate variability.
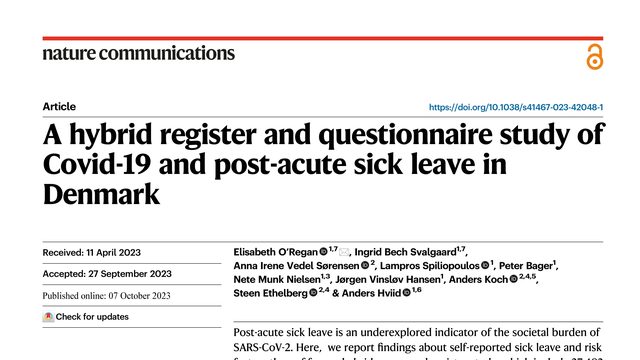
Elisabeth O’Regan, Ingrid Bech Svalgaard, Anna Irene Vedel Sørensen, Lampros Spiliopoulos, Peter Bager, Nete Munk Nielsen, Jørgen Vinsløv Hansen, Anders Koch, Steen Ethelberg, Anders Peter Hviid
Covid can end as an emergency and still leave a mark on ordinary working life. In Denmark, people who had the infection were more likely to spend a substantial stretch of time away from work afterward.What does Covid-19 look like when the emergency is over, but its effects are still showing up at work? In this Danish study, infection was linked to a clear increase in taking more than a month of sick leave.
Franziska Elisabeth Marquard, Claudia Langebrake, Dietlinde Janson, Maida Mahmud, Adrin Dadkhah, Nicolaus Martin Kröger, Francis Ayuketang Ayuk
CAR-T treatment can be difficult when the kidneys cannot clear one of its preparation drugs. Yet in this case, a patient with severe kidney impairment received the treatment, and her cancer stayed in complete remission beyond a year.CAR-T therapy often becomes harder to use when kidney function is severely impaired. This case asks whether carefully reduced dosing and timed dialysis could still make the treatment possible, and reports a striking result.
 4:25